
for CPG Brands
UNDERSTANDING FORECASTING
CPG Demand Forecasting: Why Trade Promotion Data Is the Missing Input
Accurate forecasting is crucial for CPG brands to optimize their trade promotion strategies and overall sales plans.
But forecasting trade promotions isn’t the same as forecasting total sales.
Here’s an overview of how they differ and why getting each strategy right, matters.
Why CPG Demand Forecasting Usually Gets It Wrong
If you run a $100M–$500M CPG brand, your demand forecast is probably wrong in a predictable way: it's too low before a big promotion and too high after one.
This isn't a data problem. It's a structural problem. Trade teams plan promotions in one system. Operations teams forecast demand in another. The two don't talk. So the demand forecast never reflects the promotional calendar that's actually driving volume.
The result shows up in two ways: stockouts during promotions (under-forecasted because the promotion wasn't in the demand plan) and excess inventory after promotions end (over-ordered because the lift looked like a new baseline). Both are expensive, but preventable.
Three organizational patterns cause most CPG demand forecasting failures:
- Promotions are finalized after the forecast is locked. Operations runs the Q2 forecast in January. Sales finalizes the Q2 promotional calendar in February. Nobody updates the forecast. Stockouts follow.
- Promotional history is in the TPM system; demand history is in the ERP. Reconciling the two requires manual exports and someone who knows which promotion caused which shipment spike. That person eventually leaves.
- Forecast accuracy is measured against the wrong denominator. Brands measure total forecast accuracy, averaging predictable baseline shipments with highly variable promotional shipments. MAPE looks acceptable until a stockout hits the biggest retail account.
Forecasting Trade Promotions
Trade promotions refer to temporary discounts, coupons, rebates, and other incentives that brands offer to retailers to boost product sales.
Forecasting for trade promotions involves predicting the expected incremental sales lift during a promo period. Key inputs include:
- Baseline sales without promotions
- Historical lift from similar promotions
- Details like promotion depth, frequency, duration
- Competitor promotions during the same period
The output is the estimated units or dollar value goal the brand expects to hit during the promotion.
This incremental forecast feeds into the overall sales forecast and helps set trade promotion budgets.
Forecasting Total Sales
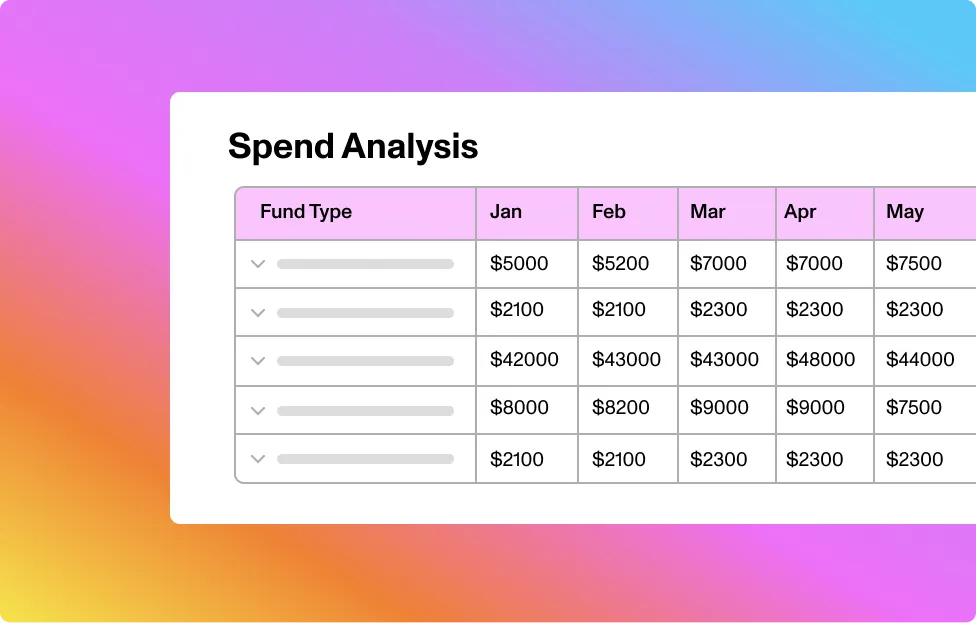
The total sales forecast projects the overall expected revenue/units for a brand across regions, products, channels, etc. Key inputs include:
.webp)
- Baseline sales absent promotions
- Incremental promotion-driven sales
- Estimates for new products, distribution gains, etc.
Total sales forecasting assembles inputs from trade promotion plans, historical data, macro trends, leadership goals, and more. It requires modeling and extrapolating a wider range of variables.
Verifying Demand Plans
Sales forecasts serve an important purpose in validating and fine-tuning demand plans.
Demand planning uses historical shipment and consumption data to project expected sales by product.
Sales forecasts can verify if these demand projections make sense for the upcoming period based on qualitative insights like:
- Promotion strategies
- Product launch pipelines
- Competitive dynamics
- Channel expansion plans
- Macroeconomic conditions
By comparing demand plan outputs versus sales forecast numbers, planners can:
- Identify unrealistic demand estimates to adjust
- Assess upside opportunities not captured in demand plans
- Get alerted to changing market conditions demanding plan adjustments
In this way, sales forecasts add an invaluable qualitative overlay to demand planning. They incorporate forward-looking insights that spreadsheets and algorithms miss.
Rather than wholly replacing demand plans, sales forecasts provide an additional lens to verify accuracy and uncover blind spots. This leads to superior demand planning and better sales execution.
Aligning demand planning, sales forecasting, and trade promotion strategies produces the most accurate view of the future. CPG brands that connect these capabilities will gain a winning edge.
Baseline Demand vs. Promotional Lift: The Distinction That Changes Everything
Good CPG demand forecasting separates two fundamentally different signals.
Baseline demand is the volume you'd ship if you ran no promotions — the steady-state driven by regular distribution, shelf placement, and repeat purchase. It changes slowly and is predictable from historical data.
Promotional lift is the incremental volume above baseline that a specific promotion generates. It's event-driven, temporary, and highly variable by retailer, promotion type, and season. A 10% TPR at Kroger generates different lift than a 15% TPR at Whole Foods.
When you can't separate the two, your forecast anchors to the wrong number. If last quarter included a major Walmart reset and a summer BOGO campaign, those volumes inflated your baseline. Next quarter's forecast inherits that inflation — and you over-build inventory for a baseline that doesn't exist.
Aligning the Two
Ideally, the incremental trade promotion forecasts will roll up seamlessly into the total sales forecast.
If promotions are forecasted too aggressively, it can skew the total forecast higher than reasonable. Make sure to incorporate ongoing checks into your process to help validate that both forecasts are always aligned!
The Metrics That Tell You If Your CPG Demand Forecast Is Actually Working
Most brands track MAPE (Mean Absolute Percentage Error) as the primary forecast accuracy KPI. MAPE is useful but incomplete for promotional businesses. Track these four instead:
- Baseline forecast accuracy — how accurate is your non-promotional volume prediction? Poor baseline accuracy indicates a data quality or modeling problem.
- Promotional lift accuracy by event type — how close is predicted lift to actual lift for TPRs vs. displays vs. feature ads? This identifies which promotion types you understand well and which you don't.
- Forecast bias — are you consistently over- or under-forecasting? Systematic bias is a fixable process issue. Random error is a data issue.
- Forecast lag — how far in advance is your forecast accurate? A forecast that's right two weeks out but wrong at eight weeks can't drive production planning.
When your trade promotion calendar feeds your demand forecast automatically — so updating a promotion updates the demand plan in real time — all four metrics improve. That's what connected demand planning is designed to do.
.svg)
NEXT UP
Introduction to Forecasting Promotions + Importance
.svg)
Own Your Future With Intelligent Forecasting.
Forecasting in Excel is tedious, time-consuming, and error-prone.
Take the guesswork out of forecasting. Vividly automates the entire sales forecasting process and updates any changes in real-time.
See how industry leaders like Liquid Death and Perfect Snacks benefit from Vividly’s intelligent forecasting.
